NHS data is only useful if it can be turned into intelligence from which smart decisions on healthcare provision can be actioned. In this chapter academics and experts look at the pitfalls, potential and practicalities of working with healthcare data analysis.
Dr Cornelia Junghans, Senior clinical fellow in Primary Care at Imperial College London, Dr James Crick, Consultant in public health medicine and sessional GP Hull Health and Care Partnership, Dr Peter Roderick, Consultant in public health NHS Humber and North Yorkshire ICB and Dr Kathrin Thomas, GP and Consultant in public health look at how to turn data into intelligence and David Sgorbati, chief analyst at the Health Economics Unit, Midlands and Lancashire Commissioning Support Unit looks at how to approach health data in primary care
How to turn data into intelligence
Roy Lilley said it best when it comes to NHS data. He says there is a Goldilocks zone for data because ‘without data, the NHS is flying blind. With too much data, it’s flying in a blizzard’.[1] In other words, decision-making is enabled when there is just enough good-quality data.
But data alone only tells one part of a story. To be really useful, it needs to be turned into intelligence, which can provide a clearer insight into the context of a community or geography.
Turning data into intelligence is relevant, whether the focus is a single street or a whole country. But when considering larger populations or areas, it is essential to appreciate the socioeconomic context. That is because the mean is more likely to obscure outcomes in disadvantaged populations. Paraphrasing professor in public health, Margaret Whitehead, ‘the average’ is the enemy of public health intelligence. So, when thinking about averages, we should always ask who is most affected – who loses out and who benefits?
For example, take a large local authority where the rate of deaths in those under 75 years due to cardiovascular disease (CVD) is 59.0 deaths per 100,000 population. Compared to the England average of 70.4, the rate seems pretty good.
However, hiding in the local authority average, there is a district reporting 81.5 deaths per 100,000. That could be easily overlooked in the NHS data. So, to focus resources where they are most needed, it is imperative to understand the local variation and context of the data.
All factors matter
CVD is a good example where the NHS already acts on primary, secondary and tertiary prevention, and risk stratification. CVD is a multifactorial condition which has physiological (e.g. age, ethnicity), behavioural (e.g. smoking), psychosocial (e.g. loneliness), as well as environmental (e.g. air pollution) risk factors.
Environmental factors are considered ‘social determinants’ of health. And while physiological and behavioural risk factors are often seen as the causes of illness – perhaps because they are within reach and easier to measure – it is often wider determinants that are the root cause of ill health.
Even though the NHS cannot address these wider factors directly, the data still matters. If the data is included in the picture through local, regional, and national partnerships, those determinants can be addressed together. And if they are not considered as part of the analytic process? Then the health service will continue to be a sickness service.
Ideally, intelligence should be easily accessible and shared with the population. That way, they can co-produce approaches and interventions. It would also help them better understand why resources might be deployed differentially based on the evidence of need.
Some areas have taken this approach further. The Northumbria Health Index is an excellent example of how data from various sources have been brought together to develop meaningful and actionable intelligence that shapes the conversation with the public and allows the development of services to address local needs.
The public health perspective
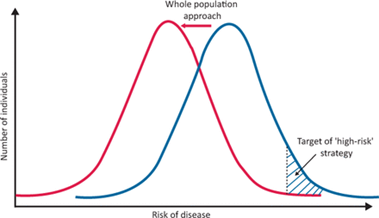
The journey from data to intelligence is beset by a number of potential pitfalls, which public health specialists have often highlighted. Clinical approaches that focus on the individual must be modified when looking at whole populations. Among them is the tendency to prioritise those in the highest risk category, with little attention to those under a certain physiological threshold (for instance, a blood pressure (BP) reading of 140/90).
This pitfall is termed the ‘prevention paradox’, a phrase coined by Geoffrey Rose in his seminal 1985 article Sick Individuals and Sick Populations[2]. In this, he argues that the highest volume of health need and healthcare use comes from those at lower levels of risk, as this is where most people are. So, strategies that identify those with a high BP to reduce it through lifestyle and medication will be less effective at population level than an approach that aims to decrease the mean BP of a whole population, such as policies to reduce dietary salt or enable active travel methods in a local area.
Source: The ethics and politics of addressing health inequalities | RCP Journals https://www.rcpjournals.org/content/clinmedicine/21/2/147
As Rose puts it, ‘a large number of people at a small risk may give rise to more cases of disease than the small number who are at a high risk’. Additionally, when measuring the success of interventions targeted at ‘high risk’ populations, we risk overestimating our success due to a further pitfall – ‘regression to the mean’. That is, the tendency of people at a crisis point in health to naturally return to a steady state, which we then often wrongly attribute to our actions.
GP practice data
GP practice data is rich and large enough to provide great insights into whole populations. That’s of enormous value when making intelligence-driven decisions for an area.
For example, when it comes to using GP practice data, we need to shift our thinking to improve population health. Individual interventions targeted to those at most risk may be clinically appropriate and necessary, but a whole-population approach is needed.
That means a greater focus on the following:
Upstream
This is utilising low-cost, high-volume interventions such as smoking cessation services, embedded financial inclusion support in practice, or mass text message approaches using behavioural insights to increase cervical screening uptake.
Inequalities awareness
The ‘inverse care law’ [1] posits that the higher your level of need for quality healthcare, the less likely you are to receive it. Putting in remedies to address this will align with Professor Sir Michael Marmot’s ‘proportionate universalism’.[2] That is, everyone receives the universal offer of primary care, but those from deprived backgrounds – or inclusion health groups – are given increased resources, swifter access and greater help, such as GP at the Deep End.
Social
Evidence suggests that timely good quality clinical care only contributes around 20% of our health. So turning data into intelligence thus challenges primary care to understand the social factors behind disease registers and activity data and work more closely with local public health colleagues and the voluntary and community sector in addressing the social determinants of health.
The impact of underfunding
As Julian Tudor Hart put it: ‘Early interventions, requiring little technical skill but much time and thoughtful social experience and judgement can be far more cost-effective than late crisis interventions using high technology and expertise.
‘Yet over and over again, resource-starved acute services are compelled to steal from anticipatory care budgets so as to sustain crisis care and thus hopefully avert public scandals, careers pillorying by journalists, and the ire of politicians whose careers depend on the next election.’
The trouble is, says Hart, no one can justify withholding care in a crisis because it would be more cost-effective to provide anticipatory care for those not yet in crisis. He goes on: ‘When services are grossly underfunded overall, as they were in the UK for at least last three decades of the 20th century, anticipatory care of people not yet seriously ill is forced into grossly unequal competition with heroic end-stage salvage, and loses every time.’ [3]
The limits of GP practice data
Data certainly has its uses. But just as important is the data that is missing. Abraham Wald, a statistician working for the US Military, figured this out when asked to decide where to place armour on planes to protect them from being shot down.[4] Others suggested the obvious – putting armour plating over the wings because planes that had returned from battle had wings riddled with bullet holes. But Wald asked for the plating to go on the areas without bullet holes. He realised that they were looking only at the planes able to fly home despite the bullets. The ones that got shot down were unavailable for inspection.
We can think of data in the same way. GP practice data only includes the people who, by definition, successfully register and attend their surgery. So, when we tailor services to those deemed most worthy of intervention, we might be getting it wrong. They may not actually be the ones who are the most vulnerable and in need of our help.
While we might find ways to include some of these people and collect the data, it’s not always feasible. The most predictive factors for needing state-funded adult social care are a decline in activities of daily living, change in personal finances or informal social support. However, these factors are likely too private, too complicated or changeable to collate and maintain. And it would be even harder to act on the information in a timely manner.[5]
Thinking beyond the numbers
And then there is the intelligence beyond the data. We might know from the data that a patient is a frequent attendee at their GP practice and A&E. It will also tell us their ethnic background, gender and preferred language. But it is only when you speak to the patient that you find out that the reason they present multiple times is that they can’t read or write and don’t know how to take their medication correctly.
Data thus becomes the start of a conversation, not the be-all and end-all. Or, in fact, the start of multiple conversations. For example, when we use data, we can join up people with shared characteristics who would not otherwise know each other and enable self or better each-other care, as with group consultations and patient groups. This might be the true power of primary care data.
So, we need to continue to change our mindset. GPs are not just in the business of treating disease but also creating health. Social determinants are our business too, not just the realm of a social prescriber. Prevention conversations are not a luxury – they are essential to shift the needle on health.
QOF may have inadvertently widened inequalities by encouraging GP practices to aim for just enough with limited resources while the remaining percentages represent the hardest to reach and the easiest to ignore. Data analysis and good intelligence-driven local healthcare decisions by ICBs are no longer a nice-to-have; many people are doing it already. If done well, it reduces demands on services in the long term, hits the targets we want, and we do right by our populations.
This article was first published as a two-part series in Healthcare Leader in January and February 2023.
How to look at data in Primary Care
Primary care holds some of the richest data in health and care which can tell us a great deal about local populations and their needs. However, faced with so much data, it can be difficult to know what to look at and what we can do with it to drive improvements in health and care of our population. David Sgorbati, chief analyst at the Health Economics Unit, Midlands and Lancashire Commissioning Support Unit offers his insights.
Data is incredibly powerful when it comes to helping us make decisions about changes to care pathways or the allocation of resources and it really is true that primary care networks (PCNs) hold the Crown Jewels of NHS data. As the ‘front door’ of the NHS, PCNs have an unrivalled insight into their populations, covering everything from consultation data to prescription information and a whole host of secondary care markers. What’s more, they also have a very deep and profound understanding of the community and its needs. For this reason, it’s vital that they are involved in shaping any collection and analysis of local data.
Familiarising with uncertainty in your data
Firstly, it’s important to get familiar with the limitations or weaknesses in your data. For example, there is always bias in data due to either the way in which the dataset is defined or in how the data are recorded. Health data typically represents certain groups more than others and this is something that must be considered when developing data driven insight and planning onwards action.
Another common issue with health data is that there isn’t really a standard approach to how we record information. The way each GP practice in a network records certain data may vary. It may also vary between GPs within a practice, and even individual GPs might use different approaches from one day to the next. For this reason, it can be beneficial to lean on those who understand how the dataset was created as well as those who understand your patient population when embarking on a project.
What’s the right question?
One of the most crucial elements to get right when starting any data analysis project is choosing the right question. That might sound obvious, but it can be challenging to ensure the question we’re asking will give us the answers we are looking for. For example, we might say we want to understand how many patients are attending A&E each month. However, the answer we are looking for here might really be what proportion of patients attend A&E, or what the characteristics are of those patients who attend A&E, or even why patients are attending A&E, so we can understand if there are any trends or unexpected variations in the type of patients we find.
This is where combining your rich data and local expertise with the know-how of an experienced and professional analyst can help you frame the question correctly from the start. This is known as problem structuring and is an absolutely critical step in any successful analytics project. Without spending time on clarifying and applying some critical thinking to the question in hand, you will often later find that you’ve wasted a lot of time analysing the wrong pieces of information. If you do this in partnership with an analyst, it can also help you to understand and appreciate what analysts are truly capable of and what they need to be able to deliver on your request.
The role of the analyst and how to empower them
Data analysis is powerful, but it’s also challenging and complex and is best attempted by people who truly understand data and the many ways in which it can be interpreted and analysed. The analyst profession is a varied one, and not all analysts are the same. For example, within our team at the Heath Economics Unit we have data engineers, analysts, data scientists, health economists and econometricians – all with specific skillsets and areas of focus. Very few people can do all of this (and do it well) and, especially when dealing with people’s health, it pays to draw on the right expertise.
For example, it’s important to use the right tools and algorithms when embarking on an analysis project, as some will be completely ineffective against certain types of questions and datasets. A professional analyst will know what approach to use and when to get the best result. This is why it’s crucial to employ the services of the right kind of analyst with the appropriate skills and experience. Often the problem you are trying to solve will be complex and it may require the inputs of several different kinds of analysts.
In some parts of the health system, most notably for Civil Service roles, individuals are expected to align with competency frameworks, and it is seen to be beneficial to do so. In other areas, specifically the wider NHS, this is less well-developed and there can be a lack of direction for analysts in terms of understanding which framework they should align to. The benefits of adopting a common framework for analytical disciplines are numerous for all parts of the system, including patients, employers and individual analysts.
To support the upskilling of analysts, the Health Economics Unit and the AnalsytX community have been working in close partnership to develop the Population Health Data and Analytics Centre of Excellence. We have collaborated with NHS England, the Association of Professional Healthcare Analysts (AphA), local analytical teams and the healthcare data industry, to build a curriculum with pathways for training. We have also worked to identify existing resources and best practices to upskill analysts and improve every interaction with data in the population health management cycle. The curriculum helps guide people towards the training that is relevant to them at each point in their career.
If you do already have an analyst role embedded in your PCNs or wider system, there is plenty of opportunity out there for professional development and upskilling. Over recent years, and particularly since the start of the Covid-19 pandemic, a buoyant community has developed through networks such as AphA and the NHS Python and Analyst X communities. These offer many options for analysts to share best practice, offer peer-to-peer support and access professional training and development opportunities.
Intelligence-led improvements in health and care: Population health management
Of course, data analysis is important, but how can you take the insight you gain and use it to support you in making decisions about how you care for your community? There are many different insights you can glean from your data which can help you target interventions or resources most effectively. However, it can be challenging to do this successfully without also considering the wider determinants of health, which are central to the concept of population health management. The worsening cost-of-living crisis we are living through makes this more important than ever, as an increasing number of people begin to fall into extreme poverty, or even destitution.
For example, studies suggest that homeless people are dying 30 years earlier on average than the general population. This doesn’t just apply to those living on the streets, but also those in sheltered accommodation where alcohol and drug misuse are common. This demonstrates why we must start to look more at identifying the people who are seemingly well today but who may become ill in the near future, rather than focussing solely on treating those who are already unwell.
There are several places to find population health data, including the Office for Health Improvement and Disparities’ (OHID) fingertips tool, which gives information about the population at a granular level. It is not linked to individuals but can provide a good overview of the wider determinants of health. Local authority, Integrated Care Systems or Integrated Care Boards may have have a population health management team who could help.
In different projects we have also worked with GPs to provide insights at a high (multi-patient) level, supporting them to better undertake quality improvement case-finding activities in their own patient data systems and enabling them to drill down and identify those patients with suboptimal care who require additional attention.
At the Health Economics Unit, we do a lot of work on population health management to help our clients make changes to the care they provide. This includes a range of services such as:
- population segmentation to help them better understand their local community,
- risk stratification to identify those most at risk of an ‘event’,
- impactibility analysis, which is about working out which segments of the population are likely to be most amenable to change,
- and allocative efficiency, which helps us understand where the most value lies.
We are currently supporting five ICSs working together with primary care to make decisions around resource allocation for COPD. Here, we are using the STAR (socio-technical allocation of resources) approach to allocative efficiency to identify the most valuable use of resources across the entire local system. STAR is made of equal parts social and technical elements. This means there is equal importance attributed to the perspectives and experiences of key stakeholders across the pathway, and the data.
First, we collect data on interventions along the pathway, each is analysed for value, in terms of quality-of-life gains, costs and the number of people who benefit. Then we get all the people involved in the pathway, including patients, into a room together. This is known as ‘decision conferencing’. Their role is to discuss the value of the current pathway using their expertise and collated local data. Finally, with vast collective knowledge of the current pathway and the population, the group then identifies key interventions for investment. This is ultimately to ensure we are doing the right amount of the right interventions along the pathway to maximise our population’s health with the limited resources we have.
Help to get started
Of course, health data is extremely complex (and not always up to date or fit for purpose) and I appreciate that not every area is fortunate enough to have access to a team highlighted in the case study. This can make attempting any kind of data analysis seem daunting. That said, just because you can’t do everything you might want to do, it doesn’t mean you should do nothing. Knowledge really is power and there is no better knowledge than that which is backed up by solid data analysis. Organisations such as the Health Economics Unit, the Strategy Unit or AphA boast a wealth of expertise and a deep understanding of the different analytical communities and various approaches you can take and would be more than happy to help you understand your requirements.
By David Sgorbati, chief analyst at the Health Economics Unit, Midlands and Lancashire Commissioning Support Unit first published on sister title Pulse PCN
[1] Tudor Hart, J. The Inverse Care Law. The Lancet Vol 1971; 297, 7696: 405-412
[2] Marmot, M. Fair society, healthy lives: the Marmot Review : strategic review of health inequalities in England post-2010. (2010)
[3] Tudor Hart, J. The Political Economy of Healthcare: a Clinical Perspective. 2006: 131-132
[4] Ellenberg J. How Not to Be Wrong: The Power of Mathematical Thinking. New York: The Penguin Press; 2014.
[5] Nakubulwa M, Junghans C, Novov V, Lyons-Amos C, Lovett D, Majeed A, Aylin P, Woodcock T. Factors associated with accessing long-term adult social care in people aged 75 and over: a retrospective cohort study. Age Ageing. 2022 Mar 1;51(3):afac038. doi: 10.1093/ageing/afac038. PMID: 35231093; PMCID: PMC8887841.