NHS data can help make smart decisions on healthcare provision. But there are pitfalls when it comes to data analysis. Dr Cornelia Junghans, Dr James Crick, Dr Peter Roderick and Dr Kathrin Thomas explain what they are in this first article of a two-part series.
Roy Lilley said it best when it comes to NHS data. He says there is a Goldilocks zone for data because ‘without data, the NHS is flying blind. With too much data, it’s flying in a blizzard’.[1] In other words, decision-making is enabled when there is just enough good-quality data.
But data alone only tells one part of a story. To be really useful, it needs to be turned into intelligence, which can provide a clearer insight into the context of a community or geography.
Turning data into intelligence is relevant, whether the focus is a single street or a whole country. But when considering larger populations or areas, it is essential to appreciate the socioeconomic context. That is because the mean is more likely to obscure outcomes in disadvantaged populations. Paraphrasing professor in public health Margaret Whitehead, ‘the average’ is the enemy of public health intelligence. So, when thinking about averages, we should always ask who is most affected – who loses out and who benefits?
For example, take a large local authority where the rate of deaths in those under 75 years due to cardiovascular disease (CVD) is 59.0 deaths per 100,000 population. Compared to the England average of 70.4, the rate seems pretty good.
However, hiding in the local authority average, there is a district reporting 81.5 deaths per 100,000. That could be easily overlooked in the NHS data. So, to focus resources where they are most needed, it is imperative to understand the local variation and context of the data.
All factors matter
CVD is a good example where the NHS already acts on primary, secondary and tertiary prevention, and risk stratification. CVD is a multifactorial condition which has physiological (e.g. age, ethnicity), behavioural (e.g. smoking), psychosocial (e.g. loneliness), as well as environmental (e.g. air pollution) risk factors.
Environmental factors are considered ‘social determinants’ of health. And while physiological and behavioural risk factors are often seen as the causes of illness – perhaps because they are within reach and easier to measure – it is often wider determinants that are the root cause of ill health.
Even though the NHS cannot address these wider factors directly, the data still matters. If the data is included in the picture through local, regional, and national partnerships, those determinants can be addressed together. And if they are not considered as part of the analytic process? Then the health service will continue to be a sickness service.
Ideally, intelligence should be easily accessible and shared with the population. That way, they can co-produce approaches and interventions. It would also help them better understand why resources might be deployed differentially based on the evidence of need.
Some areas have taken this approach further. The Northumbria Health Index is an excellent example of how data from various sources have been brought together to develop meaningful and actionable intelligence that shapes the conversation with the public and allows the development of services to address local needs.
The public health perspective
The journey from data to intelligence is beset by a number of potential pitfalls, which public health specialists have often highlighted. Clinical approaches that focus on the individual must be modified when looking at whole populations. Among them is the tendency to prioritise those in the highest risk category, with little attention to those under a certain physiological threshold (for instance, a blood pressure (BP) reading of 140/90).
This pitfall is termed the ‘prevention paradox’, a phrase coined by Geoffrey Rose in his seminal 1985 article Sick Individuals and Sick Populations[2]. In this, he argues that the highest volume of health need and healthcare use comes from those at lower levels of risk, as this is where most people are. So, strategies that identify those with a high BP to reduce it through lifestyle and medication will be less effective at population level than an approach that aims to decrease the mean BP of a whole population, such as policies to reduce dietary salt or enable active travel methods in a local area.
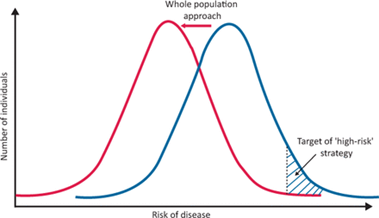
As Rose puts it, ‘a large number of people at a small risk may give rise to more cases of disease than the small number who are at a high risk’. Additionally, when measuring the success of interventions targeted at ‘high risk’ populations, we risk overestimating our success due to a further pitfall – ‘regression to the mean’. That is, the tendency of people at a crisis point in health to naturally return to a steady state, which we then often wrongly attribute to our actions.
In spite of the pitfalls of using NHS data, there are still enormous benefits to be had. In part two, we will look at how GP practice data can be used to give insights into whole populations.
[1] Roy Lilley newsletter, 10th November 2022
[2] Rose G. Sick individuals and sick populations. International Journal of Epidemiology 1985;14:32–38.
By Dr Cornelia Junghans, Senior clinical fellow in Primary Care at Imperial College London, Dr James Crick, Consultant in public health medicine and sessional GP Hull Health and Care Partnership, Dr Peter Roderick, Consultant in public health NHS Humber and North Yorkshire ICB and Dr Kathrin Thomas, GP and Consultant in public health